Introducing the TrakBox Dash
March 09, 2024 by Head of Engineering
This file was reprinted from a team blog post
My Race Data is proud to announce the racing TrakBox Dashboard file viewer.
Why Use the Dashboard?
The dashboard is great way to view the data files produced by your racing TrakBox data acquisition system. The files produced by the racing TrakBox are ordinary text files and can be viewed in any spead sheet program or text file viewer. Because the Racing Trakbox can write over 90 lines of data a second the files can be very large and finding the information you’re interested in can be difficult. The TrackBox dashboard file viewer make visualizing the data very easy.
Remember, the racing TrakBox is intended to be used only during legal sanctioned motorsports events on closed circuits.
Retrieve MicroSD Card
The first step in viewing the files your racing Trakbox records is to retrieve the microSD card from the unit. Pop the snap off lid from the TrakBox. The enclosure snaps open by gently squeezing the sides of the lid and gently lifting. Push gently on the microSD card and it will spring out of the slot. Place the microSD card in the adapter sleeve that came with your card and insert into a laptop or PC. Copy the files to the laptop or PC. This step is important because the files can be large and reading them directly from the card would be slow. You will find your files in the root folder of the SD card. The file will be named trakbox.csv Once copied, the file may be renamed to any file name but the .csv file extension must remain for the viewer to open it.
Every effort is being made to make the dashboard work on a cell phone browser but it is suggested at this time (Spring 2024) that you view your data files in the TrakBox dashboard on a larger screen such as a tablet, laptop or PC.
Load the File
Once you have saved your files to a PC or laptop, open your browser and go to
TrakBox Dashboard In the upper right corner click the ‘Choose File’ button. A Dialog box will open allowing you to navigate to the location where you have saved your file. Choose your file and click the ‘Open’ button. The file will take a few seconds to load, be patient with large files.
What is a Session
When the file is processed, it will be split into sessions. Each session is a continuous recording. The TrakBox only records when you are moving to save file
space. Recordings made on different dates and at different times will appear as
separate sessions. On larger screens, the navigation menu on the left side of the
window will list all of the sessions. You may switch between sessions by clicking
on them in the nav menu or using the ‘Sessions’ drop down list button. The navigation menu on the left also includes the date of the session and the total elapsed time of the session. When the file is first loaded, the most recently recorded session is loaded in the viewer.
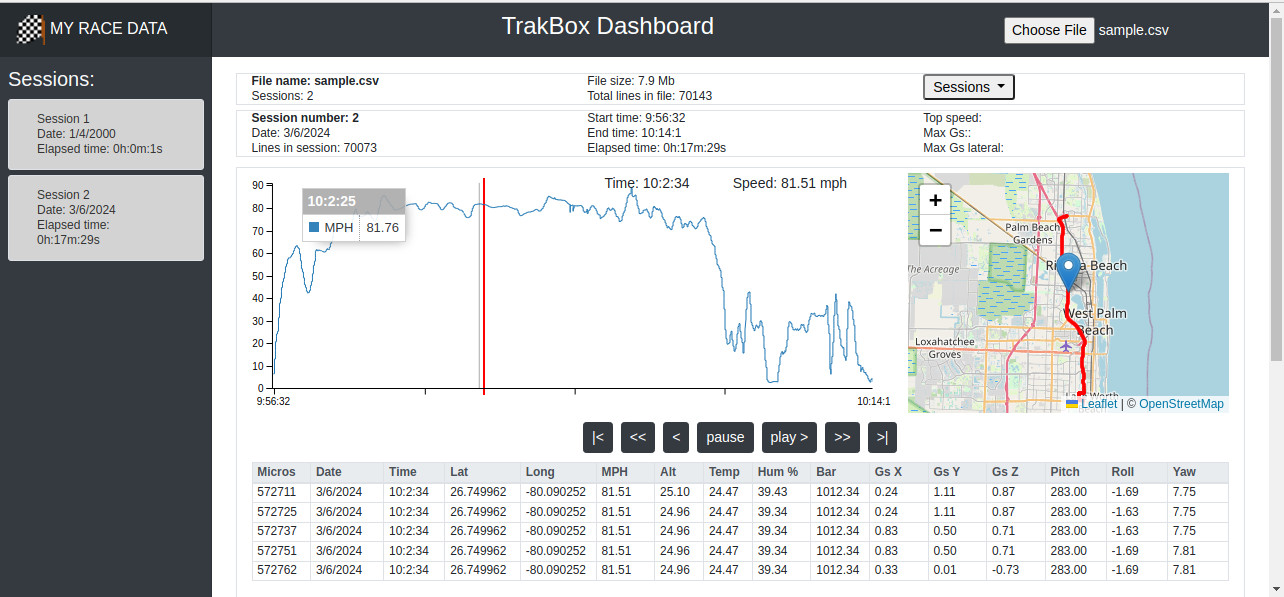
The TrakBox Dash Window
At the top of the main window are the file statistics. The file name, size
of the file and the total number of sessions are shown in the file statistics box.
Each time the TrakBox records the sensor data, it writes one line of data to the file.
The total number of lines of data in the file are also shown in the file statistics box.
Below the file statistics are the session statistics. The date, start time and end time are shown as well as the total elasped time of the recording. The number of lines of data making up that session is also shown.
The chart is plotted over time showing the vehicle speed in miles per hour. To the rightof the chart is a GPS map with the track of the session recording ploted on it in red.The red vertical cursor line on the chart and the blue marker on the GPS map are atthe starting point of the recorded session. As you hover your mouse over the chart a small tool tip showing the time and MPH will pop up. Clicking on the chart will jump the red cursor to that place in the recording. The marker on the GPS map will also fly to the location of the vehicle on the map. You may zoom the GPS map in and out with the plus (+) minus (-) buttons in the upper left corner of the map. You can also drag the map.
Navigation
Below the chart and map are the VCR buttons and the data table. The data table shows the actual recorded sensor readings from that moment. You can click the play button to play the session like a movie. The cursor will move along the chart and the marker will follow your track on the map as the data table scrolls the values. The fast foward button (>>) will play about three times faster then real time. The rewind button (<) and fast rewind button(<<) will jump back in time. The start button (|<) and end button (>|) will jump to the begining or end of the session and the pause button will stop playback.
What Next?
The My Race Data team has just begun developing the TrakBox Dash file viewer. Many further enhancements are planned. In fact that is the whole purpose of this website, to provide tools and information to help racers and engineers use technology to develop quicker safer racing vehicles.